Introduction
Many readers are familiar with the widely used method of Fourman and Mullen [1] in setting cleaning validation/verification limits for pharmaceutical manufacturing facilities. Implicit but key to use of the method is the assumption that residues are uniformly distributed [2, 3] on processing equipment. However, the assumption, which on some occasions may be conservative, has drawbacks and data will be presented from a drug substance pilot plant that shows uniform distribution of residues does not usually occur. Therefore employing this supposition can result in re-cleaning equipment that, in fact, would have produced material that met the pre-established cleaning criterion.
Pilot Plant
A while ago, I was involved in the commissioning and operation of a GMP drug substance pilot plant designed to manufacture batches 10 kg and under. Cleaning verification is used rather than cleaning validation, because it is a pilot plant, and only one or two batches of a particular product may be manufactured. Since the products manufactured in the Facility are intended for early stage clinical trials, exact dosages of the drug substances may not be clearly defined. It was decided to employ a “10 ppm residue” criterion, as suggested in [1] for cleaning verification. That is, the carryover of a product A into the next sequentially manufactured product, B, is limited to not more than 10 ppm of batch B. Plant standards called for the use of Total Organic Carbon (TOC) testing for cleaning verification rather than a compound specific analytical method.
Figure 1 shows a simplified flow diagram of a drug substance manufacturing process. Identical starting and raw materials are reacted in two smaller reactors, R-1 and R-2 of the same size. Upon reaction completion in these vessels, their contents are added to a third, larger reactor, R-3. An ingredient is added to R-3 via a pump, P-1. Wet product is isolated on a single plate Nutsche type filter, F-1. Finally the wet product is vacuum dried on a glass Pyrex® tray, T-1. Table I shows the surface areas of each equipment item.
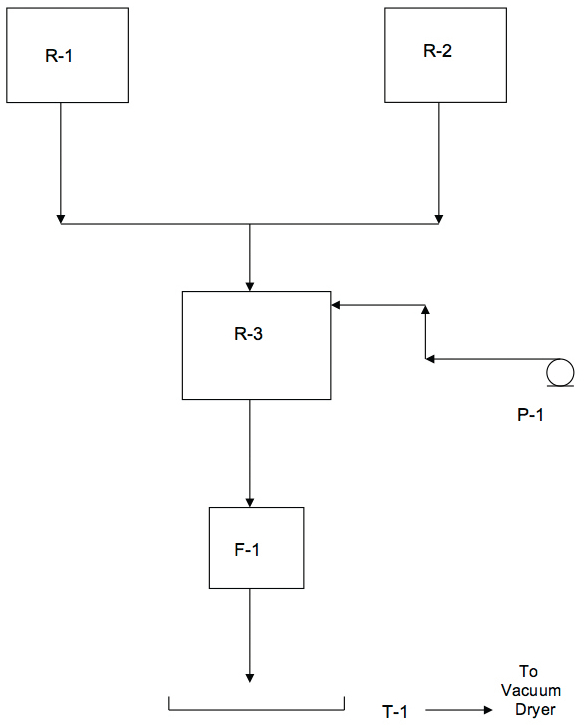 Figure 1. Drug Substance Pilot Facility Flow Diagram
The anticipated batch size of dry product was 2.2 kg. Assuming a 10 ppm residue limit, the maximum amount of residue that can be present in the batch is 22 mg.
Table I shows limits for each equipment item calculated assuming that the residues are uniformly distributed. This calculation is performed by dividing the surface area of the individual item into the sum of the surface area for all equipment, then multiplying this fraction by the 22 mg residue limit. Also listed in Table I are the residue levels on a mg/cm2 basis, milligrams residue divided by the equipment item’s surface area.
Table 1. Pilot Plant Facility

The three reactors were cleaned via boil-up, with samples taken and tested for TOC content. Each reactor was boiled-up with Purified Water USP, at approximately 10% of its capacity. The pump was disassembled, scrubbed clean, re-assembled and then rinsed through with Purified Water USP with a sample of the rinse water removed for TOC analysis. The filter was scrubbed clean, dried and then swabbed. The tray was soaked in an aqueous caustic cleaning solution, dried and then swabbed. The allowable sample residue level in ppm is calculated based on the volume of the boil-up or rinse water, the volume of the sample itself and the area swabbed, if applicable, as the example calculations demonstrate below:
R-1: ppm = (3.11 mg/1000)/(2000 grams boil-up solvent) x 1000000 x 0.6 = 0.83
Where the number, 0.6, accounts for the carbon content of the compound manufactured.
F-1: ppm = (5.52 mg/5894 cm2 x 1000000x 0.6 x 100 cm2 swabbed)/ (40 x 1000) = 1.40
Where 40 is the swabbing solution volume in milliliters.
It is necessary to perform the above calculations because the TOC analyzer provides results in ppm TOC per sample. Note that the quantities shown for the equipment items in all tables represent sample TOC results, not overall batch TOC.
Actual TOC results after the initial cleaning are summarized in Table II. For swabbed items, a swab recovery factor is included. Results are also back-converted to milligram quantities found in each piece of equipment, using the equations shown above.
Table 2. TOC Cleaning Results
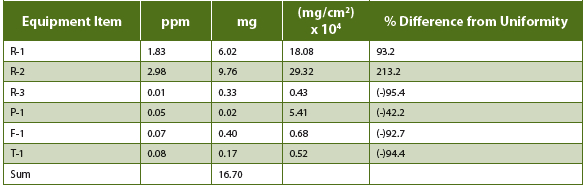
You’ll note that that the results for R-1 and R-2 are out of specification (OOS), 1.83 and 2.98 ppm versus 0.83 ppm allowable. Also shown in Table II are the actual TOC results for all equipment items back-converted to milligram quantities. When these quantities are summed, the result, 16.7 mg, is well below the allowable level of 22 mg. The 16.7 mg sum represents the actual amount of residues in the batch and is equivalent to 7.6 ppm in a 2.2 kg batch.
Another observation from Table II is that the actual residue distribution across the equipment items is not uniform. R-1 and R-2 are identical pieces of equipment, were cleaned by exactly the same procedure and yet have different TOC results. R-3, the largest reactor, had very low residue levels. The remaining equipment had very low and varying residue levels.
Therefore the original assumption of uniform residue distribution is not validated by the above data. The non-uniformity of the data is more dramatically shown when calculated on a mg/cm2 basis, as shown in Table II. Percent differences from uniform distribution (0.000936 mg/cm2) are also listed in the table. Figure 2 shows the Table II data graphically.
 Figure 2. Actual TOC Results for the Pilot Facility Compared to the Assumption of Uniformity
Because the assumption of uniform residue distribution was utilized in facility cleaning verification protocols, the equipment had to be cleaned until it passed the pre-established criteria. This resulted in one additional boil-up for Reactors R-1 and R-2 as well as additional analysis time for the TOC samples. Here we see why the uniformity assumption can be conservative. In this particular instance, it resulted in basically an unnecessary re-cleaning when in fact the equipment as cleaned initially would have manufactured material that met the 10 ppm criterion.
Several subsequent cleaning verification studies conducted for the facility also showed non-uniform residue distribution.
A Scaled-Up Commercial Facility
The reason why this became an issue is because of the small batch sizes manufactured in the Pilot Facility. Employing a 10 ppm criterion meant that only a small absolute residue amount can be tolerated. Note in Table I that the criteria for the reactors are all under 1 ppm.
We can verify the previous supposition by hypothetically scaling the process to a commercial size. I assumed a typical full scale batch size of 220 kg. R-1 and R-2 would be 750 gallon Reactors and R-3 would scale to 1500 gallons. At least several trays would be required for vacuum drying of the product. With a 10 ppm residue criterion, 2200 mg can be tolerated in the commercial batch.
Note the ppm levels in Table III are considerably higher than those in Table I, despite the fact that the same 10 ppm batch criterion is utilized. Therefore it is the small batch size produced in the small scale facility that made this issue arise. Larger batch sizes will make cleaning limits less difficult to meet assuming a 10 ppm residue criterion.
Table 3. Commercial Facility

Summary
The concept here is not to use the uniform residue distribution assumption to establish cleaning criteria for process equipment. It is an ideal assumption that is unlikely to occur in real-world processing equipment.
However, what I am proposing here is to look at the system as a whole. Determine the sum of residue levels based on all equipment utilized and release the system based on that data. After all, the purpose of cleaning equipment is to assure that the equipment produces a batch that is free of cross-contamination.
An FDA Guide from the 1990s [4] warns against the assumption of uniform residue distribution, although the example given in the Guide is somewhat different that what was discussed above.
It could be argued that with the above proposal, control is lost on each piece of equipment. To counter this objection, I suggest trending cleaning results for equipment items to chart changes or build up of residues. Trending these results is something that should be done regardless of the procedure used to release process equipment. Should control or run charts indicate a trend in residue results, an investigation could be conducted and the equipment could be re-cleaned if necessary.
While the above work was performed on a drug substance facility, it should be applicable to finished drug product manufacturing as well.
To apply this method to any GMP facility, convert the ppm TOC results into milligram quantities, as was done in the examples above and Table II. Total the quantities and check the result against the pre-established criterion, for the above pilot facility, 22 mg, or 10 ppm of residues in the batch.
References
- Fourman G, Mullen M. Determining Cleaning Validation Acceptance Limits for Pharmaceutical Manufacturing Operations Pharm. Technol. 1993; 17 (4): 54-60.
- LeBlanc D. Establishing Scientifically Justified Acceptance Criteria for Cleaning Validation of Finished Drug Products Pharm. Technol. 1998; 22(10): 136-148.
- Thomas J. A Cleaning Validation Master Plan for Oral Solid Dose Manufacturing Equipment J. Validation Technology 2000; 6 (2): 522-530.
- US Food and Drug Administration Guide to Inspections Validation of Cleaning Processes July 1993 FDA, Rockville, MD.
George F. Klein is a process consultant specializing in drug substance and drug product manufacturing. He has 38 years of process manufacturing experience and has worked for KBR, Eisai and Pfizer. George’s experience covers API chemical synthesis, oral dosage forms (tablets, capsules, liquids, ointments), sterile fill and freeze dried products.