Helen Smith - Senior Data Coordinator, PHASTAR
Collection of good quality data from clinical trials is essential to data analysis in order to produce robust results that meet the precise requirements for regulatory need. Data from clinical trials is increasingly complex in nature, related to involved protocols, geography of trial sites, increasing data streams and technological advances. It is essential that studies are set up to be efficient, offer support and training to trial sites and ensure that the right data is collected in the right way.
Data Management teams have historically reviewed data once Source Document Verification (SDV) has taken place by the Clinical Monitors, on an ongoing basis, so that data issues can be actioned early in the trial and corrective action put in place. This has been a very manual process, thorough and time consuming, and has left less time to focus on insightful analysis of the data.
Collaboration: Data Science and Data Management
Data science and data management teams have begun successfully collaborating to explore ways in which data quality can be improved in an efficient manner. Data science provides opportunities and techniques to highlight potential data issues. Data management apply their expertise to highlight the critical data and to analyze the results of data science review techniques. Each approach is first implemented on small studies and, once shown to be effective, integrated into the overall process. Implementation is a multi-faceted approach applying data science approaches within data management, to drive efficiencies in terms of time and cost whilst ensuring high quality data.
Different approaches have been implemented; aimed at simplifying the search space for data managers. In any given clinical trial, there may be thousands or even tens-of-thousands data points; a handful of which may be problematic.
Traditionally, data review would occur at the datapoint to identify the data issues (both with electronic programmed checks but also manually) and raise individual queries to site. Using an intelligent approach, this search space can be reduced. A data management expert will still need to review the data issues and inconsistencies but will be looking at a reduced field, which drives efficiency.
Smarter Data Science Leading to Efficiency
A variety of different data science techniques are being explored in the context of data management, to build usage, expertise, and drive efficiencies. These include the application of AI to deliver insights around the most problematic areas of data collection on a trial. Issues identified could relate to database design, a particular data source, local trends, training, and support requirements. The insights are interpreted along with a data management study expert to understand the context and act accordingly. Additionally, a rule-based approach has been successfully implemented to highlight complex inconsistencies. In a human-machine hybrid approach this method narrows down the search space for data reviewers so efforts can be prioritized.
Another key area of data science that has a large impact on the data manager’s role is the development and application of visual analytics; the creation of effective visualizations to monitor patterns in the data during the trial.
Data Visualizations
This article concentrates on the use of data visualizations to support the data management teams. Interactive visualizations enable teams to focus on specific risk areas. For example, to support risk-based monitoring and centralized statistical monitoring, the remote evaluation and analysis of data being generated during the clinical trial. This approach really focuses on the data, highlighting outliers and deviations from the mean, identifying data errors and even potential fraud.
Data quality is essential for the success of a clinical trial. Traditionally 100% SDV was done at site where source notes were checked against the eCRF data, where there are differences data queries would be raised. Data management would then review data after SDV to detect further data queries. This approach has caused challenges during the COVID-19 pandemic as monitors have been unable to visit sites.
Risk-Based Approach with ICH-E6-R2 Regulation
Regulatory guidelines now support a different approach with ICH-E6-R2 acting as a driver for a risk-based approach. Team focus is on the high-risk items rather than all data. This approach is a general framework whereby the study team identify key risks up-front (high-risk data items and possibly high-risk sites) and then monitor for these risks as the study is ongoing. This helps to reduce the spread of data monitoring required and focuses effort on identifying, assessing and mitigating the risks that could impact on the quality or safety of a study.
This is further supported by studies which have looked at query effectiveness – reports suggest that whilst approximately 40 percent of manual queries raised led to a change in data, this amounted to less than 1 percent of the data in the database. Therefore, a large percentage of queries have no effect on the overall data. With an estimated cost of each manual query being up to $200 (U.S.), it does not seem to be the most efficient approach to ensuring a quality database.
Once risks are identified they can be monitored using different tools and platforms that apply rules and scoring approaches for tolerance
limits. Examples of which include:
- Study conduct – close monitoring of behavior across subjects, sites, countries which may trigger specific actions
- Safety data across trials – to both ensure and improve patient safety, often a critical aspect
- Data Integrity – identifying corrupt, erroneous or missing data
- Compliance – monitoring protocol deviations, for example
- Enrollment - ensuring the right patients are recruited to trials.
The approach allows the study team to concentrate on high value tasks for their particular study.
Visualization Tools
In support of Risk-Based Monitoring activities, we have a visualization tool that was developed in a collaboration between data management and data science. To ensure the success it was essential that data science understood the key requirements within each trial to enable the teams to monitor key risks effectively and to understand utility across studies to remove duplicated effort.
The critical elements have been around making the visualizations intuitive and useful to the user. Accuracy and near-real-time data are
essential to utility. It utilizes three types of data for monitoring, these include the clinical, metric and audit data:
- Clinical trial data at subject level; can include physical measurements such as vital signs or laboratory measures, adverse events, or efficacy measures.
- Metric data provides insight into data queries raised in relation to data inconsistencies. It allows study teams to look at numbers of queries, site responsiveness, which can be useful to monitor site activity.
- Audit data is an overview of all data in the eCRF/Clinical database up to that point-in-time. It provides dates of data entry and subsequently edits. The data itself only reflects the latest change, but the audit provides a history of how each datapoint has changed over time, when and by whom. This is an honest representation of events and can be invaluable when looking at site and user behaviors. Not only can it aid with addressing problems with data input and areas of data collection (so mitigations can be put in place), it also has the potential to detect possible fraudulent activity.
Having a visualization tool implemented across an increasing number of studies, enables the team to build a standard library of visualizations. These are pre-built to enable teams to monitor key risk areas common to many studies, such as adverse events and laboratory data. These off-the-shelf visualizations are the core parts of the tool.
The utilization of all three elements; the clinical, metric and audit data as described, are important when monitoring the clinical trial. They enable the teams to monitor different aspects of the data collection process.
Interactive and Customized Visualization and Integration
Visualizations are interactive enabling stakeholders to drill down into specific areas of interest. This can be extremely valuable as the amount of data generated increases significantly on a trial. Traditionally these data were viewed as static plots, whilst useful, it required teams to follow up on large tables of data to locate the points of interest and to understand context.
The data science team have also invested in building bespoke visualizations, either on different types of data or to monitor risks specific to a given study. This involves working closely with the study team experts to understand requirements.
Different types of data can be integrated, where appropriate. For example, with Electronic Patient Reported Outcome data (ePRO) – which brings challenges to teams, because of both the volume of data generated but also monitoring items such as subject burden (how the subjects use digital tools and the possible impact on them).
Clinical data visualizations which focus on adverse events can identify under- and over-reporting. Laboratory data looking at the different measures, can identify outliers, particularly at the site level and changes from baseline.
Different data types can be brought together, for example clinical events with respect to data entry can be useful in identifying problematic site behaviors. Site summaries provide a high-level view of the site performance against identified risk items.
As part of the risk-based monitoring process the review frequency is planned up-front and will drive how often visualization is used for risk-based monitoring. Interactivity provides a huge value-added over listing and chart reviews that are traditionally used. They allow the user to zoom in, which is especially useful when the plots are quite busy with many data points. Interactivity also enables for selection of data points in the plot this can help to highlight specific points, allowing the user to identify anomalies and or patterns in data, which may be pertinent for the risks they are monitoring.
Practical Usage
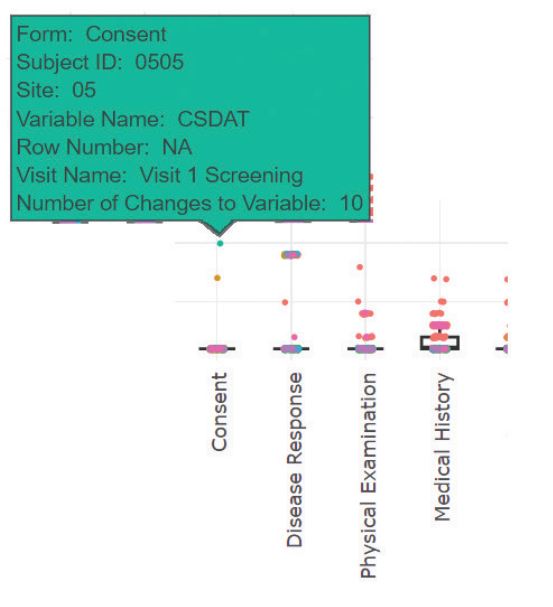
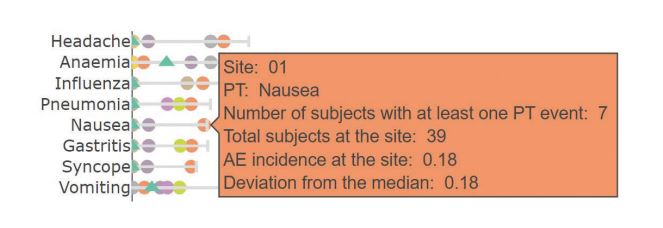
Data visualization interactivity is enhanced with tooltips, the user can hover the mouse cursor over a particular data-point or bar in a chart to provide richer information.
These visualizations support both risk-based monitoring and centralized statistical monitoring and are a valuable addition to the data management process for study teams.
Historically we have seen study teams rely on static tables for insight generation and monitoring during a clinical trial. Whilst useful, these can be time consuming and potentially error prone to process, as teams manually create Excel files and summarize in charts, for example.
Interactive visualizations in the form of dashboards can provide valuable tools for teams, making the monitoring process more efficient overall. It enables real-time monitoring and the team to focus efforts on the high-risk data and sites.
Further work will include the development of algorithms for richer insights and alerts for users relative to specific thresholds. Sophisticated visualizations will support deeper drill down into the data aligned with specific insights, bringing further benefits to the users.
Summary
In summary, using an intelligent approach to data cleaning, delivers the primary aim of driving efficiency in the overall process, with multiple activities ongoing. The is key to ensuring an effective, close collaboration between data management and data science teams. Data management bringing their specialized expertise and data science their technical expertise. The teams working together to review impact and useability in evolving cycles.
Helen Smith, BSc, ACC is Senior Data Coordinator working as part of the Data Science Department for the Contract Research Organization (CRO) PHASTAR (www.phastar.com). She has worked in Data Management for over 20 years, largely in an operational role.
Helen has experience working within a variety of CRO settings and across many therapeutic areas and study phases, in large global study teams and leading studies. She has been involved in process improvement groups, developing processes and company SOPs, with a strong focus on data quality. Helen has a nursing and NHS clinical coder background and works to apply her medical knowledge to coding and other data management activities. She uses data visualization technology to improve data quality and ensure a targeted approach to data management activities, including efficiencies.
Subscribe to our e-Newsletters
Stay up to date with the latest news, articles, and events. Plus, get special offers
from Pharmaceutical Outsourcing – all delivered right to your inbox! Sign up now!