Abstract
Pharmaceutical companies are increasing their use of outsourcing of manufacturing processes as a strategy for remaining competitive in the global marketplace. This has placed greater emphasis on process management at contract manufacturing organizations. Two parties are involved and it is critical that process knowledge and understanding be developed and communicated back and forth between the parties. Quality- by-Design (QbD) is a disciplined and systematic approach for effectively developing and communicating the needed process understanding. This article introduces the building blocks of QbD with a focus on how the needed process understanding is developed to enable effective process development, transfer, improvement and control.
Partnerships are More Easily Praised than Practiced
In order to remain competitive pharmaceutical and biotech industries have resorted to outsourcing manufacturing and other functions to contract manufacturing organizations (CMOs). As a company involves more CMOs in their work, the administration of the relationships becomes more and more complex. To address this issue some companies have moved to reduce the number of CMOs and other suppliers by forming partnerships. This is a natural progression as other industries have used partnership development as a way to deal with fewer suppliers.
The formation and utilization of partnerships is more easily praised than practiced. We quickly see that outsourcing to CMOs actually involves four parties: Pharmaceutical companies, CMOs, FDA and patients. Partnerships with CMOs work best when the needs of these four groups are satisfied. Three critical elements are needed for such partnerships to be successful: a common language, a method for continually enhancing communication and cooperation and a method for operating the manufacturing processes. Paying attention to these elements helps build the trust needed for a partnership to be successful.
Can Quality-by-Design Be Helpful?
At the same time the US Food and Drug Administration (FDA) is promoting the use of Quality-by-Design (QbD) as a method to speed up drug development and create more effective manufacturing systems. The logical question is, “Can QbD help enhance the effectiveness of CMO-Pharma partnerships?, and if so how?" The answer to this question is YES. This article shows how this can be accomplished.
What Is Quality-by-Design?
ICH (2005) defines QbD as a systematic approach to product and process development that begins with predefined objectives, emphasizes product and process understanding and process control and is based on sound science and quality risk management. Some important terms in this definition are “systematic,” “product and process understanding,” “process control,” “science” and “quality risk management.” Any QbD approach must satisfy this definition. As a result, QbD provides the critical ingredients of a partnership: a common language and methods for communicating, cooperating, operating manufacturing processes.
But a definition is not enough. We must develop a set of building blocks that capture the critical elements of the QbD system. The underlying theme of QbD can be simply stated: greater process understanding. Viewed through the lens of process understanding, it is clear that QbD’s power is equally applicable to development, manufacturing, and technology transfer (Alaedini, etal 2007, Snee 2006). In addition, piecemeal applications of statistical techniques and analytic technology do not add up to the scientific understanding of processes that QbD seeks.
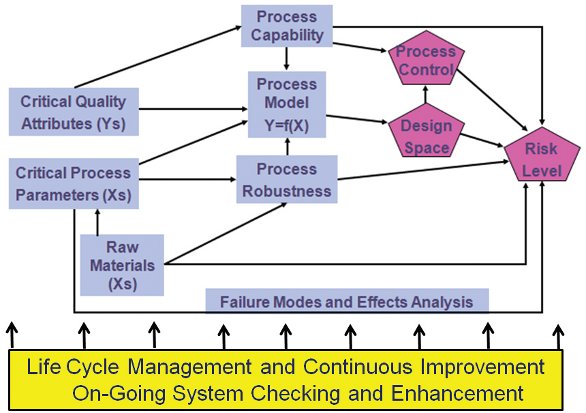
Figure 1- Building Blocks for Quality-by-Design
An enumeration of the critical elements that go into this advanced process understanding helps make QbD easier to understand (Figure 1). These critical elements are, in essence, the building blocks of the process understanding that QbD envisions (Snee 2009a):
- Critical Quality Attributes (CQAs) are the critical process output measurements linked to patient needs.
- Critical Process Parameters (CPPs) encompass the process input (API and excipient), control, and environmental factors that have major effects on the CQAs.
- Raw Materials Factors include the stability and capability of raw material manufacturing processes that affect process robustness, process capability, and process stability.
- A Process Model, depicted conceptually as Y=f(X), provides a quantitative picture of the process based on fundamental and statistical relationships that predict the CQA results.
- Design Space is the combination of input variables and process parameters that provide assurance of quality.
- Process and Measurement Capability tracks process performance relative to CQA specs and provides measurement repeatability and reproducibility regarding CQAs
- Process and Measurement Robustness is the ability of the process and measurement system to perform when faced with uncontrolled variation in process, input, and environmental variables.
- Process and Measurement Control includes the use of control procedures, including statistical process control, to hold the process and the measurement system on target and within the desired variation.
- Failure Modes and Effects Analysis (FMEA) of the CPPs, including raw material variables, identifies how the process can fail and, after appropriate controls and fixes are in place, the areas of the process that remain at greatest risk of failing.
- Risk Level is a function of the design space, FMEA results, and process and measurement capability, control, and robustness.
- Life Cycle Management is the system of activity that enables QbD and all its building blocks to be continually enhanced to deal with changes that inevitably happen over time. Central to life cycle management is the ongoing collection and analysis of process data to monitor the process and make adjustments and improvements when needed.
It is in reduced risk that all of these critical elements converge. QbD provides the process understanding that enables you to know how your process is performing, resulting in reduced risk.
With the ability to precisely identify and address the greatest risks and opportunities, life sciences organizations can realize the many2011operational, business, and financial benefits that QbD generates. Instead of incrementally improving unit operations that, in isolation, may have little effect on overall process performance or quality, manufacturers can adopt a holistic approach to QbD that is applicable at every stage of the product lifecycle. When combined with sound deployment methodologies, improvement management systems, and appropriated infrastructure, QbD dispels misconceptions with the most convincing corrective of all – a sustainable, significant increase in value.
Three Critical Systems
It was noted earlier that any implementation of QbD should be from a systems perspective. With that in mind the following focuses on three critical systems:
- Knowing when you have adequate process understanding
- Strategy for getting the right data in the right amount at the right time to create the design space
- Integrated system for process control and improvement
These three systems taken together will take you a long way toward effectively implementing QbD in a wide variety of environments.
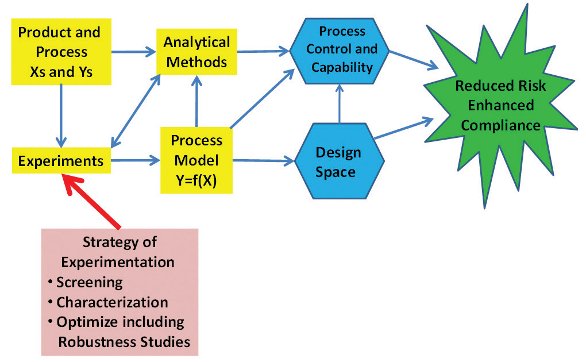
Figure 2- Experimental Strategy Building Blocks
How Do You Know When You Have Process Understanding?
Process understanding is critical to the success of the other two systems: creation of the design space and the creation of a system for process control and improvement (Figure 2). The FDA (2004) defines process understanding as: “A process is generally considered to be well understood when:
- All critical sources of variability are identified and explained
- Variability is managed by the process, and
- Product quality attributes can be accurately and reliably predicted over the design space established for the materials used, process parameters, manufacturing, environmental and other conditions”
While this definition, particularly item (3) is a good criteria to evaluate whether process understanding exists, it doesn’t tell you what to do if process understanding doesn’t exist. A better, more detailed set of criteria are needed. I have found the following check list to be very useful and effective (Snee 2006):
- Critical variables (Xs) that drive the process are known
- Critical uncontrolled (Environmental) variables that affect the process output (Ys) are known and:
- Process has been designed to be insensitive to these uncontrolled variations (robustness)
- Measurement systems are in place and the amount of measurement variation is known
- Process capability is known
- Process failure modes are known
- Process control procedures and plans are in place
- &You can accurately predict process performance
QbD provides the strategy, methods and tools for developing the data and information needed to satisfy all the elements of this checklist for process understanding. As a result, QbD provides a system for developing process understanding.
A Strategic Approach for Experimentation is Needed
Central to QbD is experimentation and how to be effective in doing experimental work to create the needed Design Space, process control strategy and risk management. The goal should be a disciplined, systematic approach that collects the right data in the right amount at the right time. Strategy for experimentation is addressed here including a roadmap for the sequence and linkage of the tools. Experience has shown that this approach speeds up the data collection process and helps assure that no critical variables are overlooked (Lonardo, etal 2010, Snee 2010a).
The first issue in developing any experimental strategy is to ensure that the critical elements are in place at the strategic, managerial and operational levels of work. At the strategic level our experimental approach needs to:
- Work to develop process understanding
- Focus on sources of variation – the sources of risk (Hubert, et al 2008)
- Identify the critical Xs – the major sources of variation (Pareto principle)
- Ensure that the strategy matches the experimental environment
At the managerial level we need management methods to guide the work and the tools used. This is accomplished by developing roadmaps for how the various pieces of experimental work fit together including the sequencing and linkage of the tools.
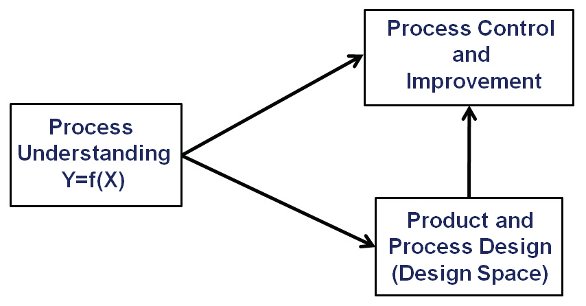
Figure 3- Process Understanding Drives Product and Process Design, Control and Improvement
Operational work involves data collection methods including the experimental designs used (DOE), process modeling approaches and tools, graphics and software. All of these activities may be new to many; hence skill building opportunities should be available to develop the needed skills. The critical elements of the approach are shown in Figure 3 and discussed below.
Table 1- Comparison of Experimental Environments/ Type of Experimental Environment
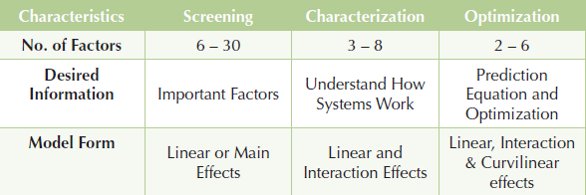
Central to the approach is a strategy for experimentation outlined in Table 1 (Snee 2010a). This strategy identifies three experimental environments: screening, characterization and optimization. The objectives of each of the three phases (desired information) are summarized in Table 1.
The Screening Phase explores the effects of a large number of variables with the objective of identifying a smaller number of variables to study further in characterization or optimization experiments. Additional screening experiments involving additional factors may be needed when the results of the initial screening experiments are not promising. On several occasions I’ve seen the screening experiment solve the problem.
The Characterization Phase helps us better understand the system by estimating interactions as well as linear (main) effects. The process modelMANUFACTURINGis thus expanded to quantify how the variables interact with each other, as well as measure the effects of the variables individually.
The Optimization Phase develops a predictive model for the system that can be used to find useful operating conditions (design space) using response surface contour plots and mathematical optimization.
The SCO Strategy (screening, characterization, and optimization), in fact, embodies seven strategies developed from single and multiple combinations of the screening, characterization and optimization phases. The end result of each strategy is a completed project. There is no guarantee of success in a given instance, only that SCO strategy will “raise your batting average” (Snee 2009b). Table 1. Comparison of Experimental Environments/ Type of Experimental Environment
Having an Integrated System for Process Control and Improvement
To date, the vast majority of the articles and presentations on QbD have focused on the creation of the “Design Space.” This is certainly a very important activity, but a process control strategy is also needed. Also, if we are to be effective in using life cycle management to manage the process over time, we must have a process management system in place that integrates both process control and process improvement (Snee and Gardner 2008, Snee 2010b).
The focus on Quality-by-Design (QbD) places an even greater emphasis on the quality of pharmaceutical products and the performance of the pharmaceutical manufacturing processes. Indeed process and product control is a major building block of QbD (Snee 2009). The strategic structure for ISPEs Product Lifecycle Implementation Plan (PQLI) has “Process Performance and Product Quality Monitoring System “as one of its critical elements (Berridge 2009). A disciplined and structured approach to achieve this objective is described below.
Assessing Process Stability and Capability
Central to any process control system is the assessment of process stability and capability. Manufacturing processes that are “Stable and Capable” over time can be expected to consistently produce productthat is within specifications and not cause harm to patients due to nonconforming product. Stability and capability are described as follows (Montgomery 2009, Oakland 2008):
A stable manufacturing process is a process that is in a state of statistical control as each batch of tablets is being produced and as batches of tablets are produced over time. A process in a state of statistical control consistently produces product that varies within the process control limits; typically set at the process average plus and minus three standard deviations of the process variation. Separate control limits are set for each parameter e.g., tablet thickness and hardness. Any sample value that is outside of these limits is an indication that the process may not be in a state of statistical control.
A capable process is one that consistently produces tablets that are within specifications for all tablet parameters. A process capability analysis compares the process variation to the lower and upper specification limits for the product. Broadly used measures of process capability are the Cp, Cpk, Pp and Ppk indices.
These descriptions show that process control limits and product specification limits are different and are used for different purposes.
Process stability and capability are evaluated at two levels:
- During the production or each individual batch to ensure that the process remains in control and identify when process adjustments are needed. Some critical questions that need to be addressed by this analysis are:
- Is the batch production process stable over the production of the batch with no trends, shifts or cycles?
- Is the process capable of meeting specifications – process capability indices acceptable?
- Is the within batch sampling variation small which indicates that the production process is stable during the production of the batch?
- Batch-to-batch control during a given year and over time from year to year. Some important questions to be addressed here are:
- Is the batch-to-batch variation stable from year to year and within years with no shifts, trends or cycles present?
- Is the batch-to-batch variation small?
These analyses will also assess the robustness of the process determining the capability of the process to produce product that meets specifications when it drifts off target.
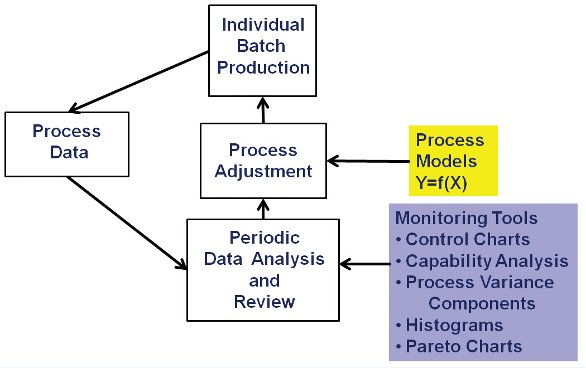
Figure 4- Individual Batch Monitoring System
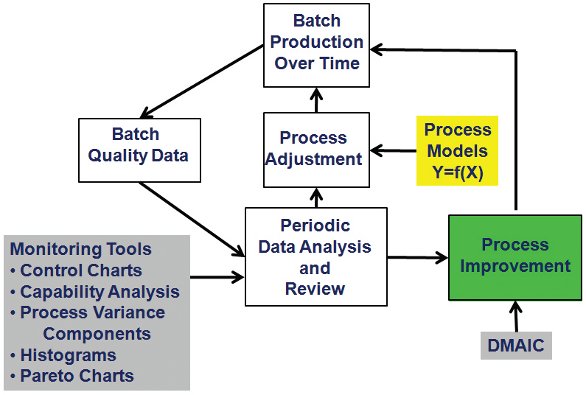
Figure 5-Batch Production Monitoring System
Systems Approach
It is generally agreed that any activity works best and is more sustainable over time when a systems approach is used to guide the associated activities and work. Schematics of such systems are shown in Figure 4 for monitoring individual batches and in Figure 5 for monitoring batch-to-batch variation within the year and from year-to-year (Snee and Hoerl 2003, 2005; Snee and Gardner 2008, Snee 2010b). The underlying system has the following characteristics:
- Data are periodically collected from the process. Pharmaceutical manufacturing processes are often monitored using 30-60 minute samples
- These data are used to monitor processes for stability and capability using control charts, process capability indices, analysis of variance, time plots, box plots and histograms.
- The analysis identifies when process adjustments are needed to get the process back on target
- Records are kept on the types of problems that are identified. As significant problems are identified or problems begin to appear on a regular basis, the resulting issues and documentation data are incorporated in the process improvement activities to develop permanent fixes so the problems do not occur again.
The process improvement work can be effectively completed using the DMAIC (define, measure, analyze, improve, control) problem solving and process improvement framework (Snee and Hoerl 2003, 2005).
QbD Can Help Create Win-Win Solutions
As pharmaceutical companies and CMOs develop relationships it is clear that success depends on three elements: use of a common language, implementation of methods of effective communication and cooperation and effective operation of manufacturing processes. QbD provides a system to satisfy this goal. Three critical aspects of this system are development of process understanding, a strategy of experimentation that collects the right data in the right amount at the right time and a process management system that integrates process control and process improvement. Using QbD as a vehicle to construct, implement and communicate these systems will go a long way to operating processes and delivering products that satisfy the needs of all parties involved: patients, pharmaceutical companies, CMOs and the FDA.
References
- Alaedini, P., R. Snee and B. Hagen (2007) “Technology Transfer by Design – Using Lean Six Sigma to Improve the Process”. Contract Pharma, June 2007, Vol.9, No.5, 4-9.
- Berridge, J. C. (2009) “PQLI – What Is It?” Pharmaceutical Engineering, May/June 2009, 36-39.
- FDA (2004) Guidance for Industry PAT — A Framework for Innovative Pharmaceutical Development, Manufacturing, and Quality Assurance, U.S. Food and Drug Administration, Center for Drug Evaluation and Research (CDER), Pharmaceutical CGMPs, September 2004.
- Hulbert, M. H., L. C. Feely, E. L. Inman, A. D. Johnson, A. S. Kearney, J. Michaels, M. Mitchell and E. Zour (2008) “Risk Management in Pharmaceutical Product Development – White Paper Prepared by the PhRMA Drug Product Technology Group”, Journal of Pharmaceutical Innovation, 3: 227-248.
- ICH (2005) “ICH Harmonized Tripartite Guideline: Pharmaceutical Development, Q8,” Current Step 4 Version, November 10, 2005.
- Lonardo, A., R.D. Snee and B. Qi (2010) “Time Value of Information in Design of downstream Purification Processes”, BioPharm International, Supplement on The Future of Downstream Processing, March 2010, 29-34.
- Montgomery, D. C. (2009) Introduction to Statistical Quality Control, 6th Edition, John Wiley and Sons, New York, NY.
- Oakland, J. (2008) Statistical Process Control, Elsevier, New York, NY.
- Snee, R. D. (2006) “Lean Six Sigma and Outsourcing – Don’t Outsource a Process You Don’t Understand”, Contract Pharma, October 2006, Vol. 8, No. 8, 4-10.
- Snee, R. D. (2009a) “Building a Framework for Quality by Design”, Pharmaceutical Technology Online, October 2009.
- Snee, R. D. (2009b) “Raising Your Batting Average” Remember the Importance of Sequence in Experimentation”, Quality Progress, December 2009, 64-68.
- Snee, R. D. (2010a) “Experimental Strategies for Implementing Quality by Design”, Pharmaceutical Processing, April 2010, 12-16.
- Snee, R. D. (2010b) “Critical Considerations in Monitoring Process Performance and Product Quality”, Pharmaceutical Technology – Analytical Technology and Instrumentation, October 2010, 38-42.
- Snee, R. D. and R. W. Hoerl (2003) Leading Six Sigma – A Step by Step Guide should be taken into account when developing and Based on the Experience With General Electric and Other Six Sigma Companies , FT Prentice Hall, New York, NY.
- Snee, R. D. and R. W. Hoerl (2005) Six Sigma Beyond the Factory Floor: Deployment Strategies for Financial Services, Health Care and the Rest of the Real Economy, FT Pearson Prentice Hall, New York, NY.
- Snee, R. D. and E. C. Gardner (2008) “Putting It All Together – Continuous Improvement is Better than Postponed Perfection”, Quality Progress, October 2008, 56-59.
Ronald D. Snee is President of Snee Associates, a firm dedicated to successful improvement initiatives using Quality by Design, Lean Six Sigma and other approaches. He is also Adjunct Professor, Temple University School of Pharmacy. Ron received his PhD from Rutgers University, is Fellow of American Society of Quality, American Statistical Association, and American Association for the Advancement of Science and has received numerous awards and honors. He has co-authored 4 books and more than 200 publications.
This article was printed in the January/February 2011 issue of Pharmaceutical Outsourcing, Volume 12, Issue 1. Copyright rests with the publisher. For more information about Pharmaceutical Outsourcing and to read similar articles, visit www.pharmoutsourcing.com and subscribe for free.