Introduction
It has never been more important than it is today to be able to comprehensively but easily review the clinical data collected during a clinical trial. Clinical review demands now require data to be analyzed and interrogated immediately to provide actionable intelligence to a variety of audiences. These audiences are assessing many targets with the data, including medical monitoring to assess subject safety, reviewing trial progress, making protocol decisions (e.g., dose escalation), analyzing data anomalies, risk-based monitoring and/or reviewing overall trial governance within a rapidly evolving clinical trial space.
Data collection is compiled from an ever-increasing research technology ecosystem (e.g., eCRF, ePRO, eCOA, central labs, biomarkers, IxRS, sensors and wearables, imaging and genomics, realworld data, social media, EMR/EHR, etc.) causing the data volume to grow exponentially. Meaning traditional paper-based clinical data review models, where questions are defined at the study level and developed into study-level data listings and reports, are not fit for purpose, because by the time reports are developed the trial has moved on and the questions have changed.
Organizations and clinical teams are becoming increasingly more distributed both nationally and globally with clinical data needing to be immediately accessible from any location in the world. In a format that supports collaboration, is consumable, delivers real-time decision-making and is portable to a wide variety of authorized reviewers. These may include, but are not limited to, medical reviewers, clinical reviewers, biostatisticians, project managers, clinical trial managers, data analytics professionals, data management, senior leadership and those who oversee the progress of their outsourced partner organizations.
Breakthrough science, searching for innovative new treatments to deliver life-changing therapies is increasing the complexity of trials.
Posing a significant challenge for any clinical data review solution to provide considerable flexibility, while maintaining the integrity of the analysis and the underlying clinical data. To provide actionable intelligence across therapeutic areas such as reactogenicity under vaccines, disease response in oncology and dose escalation assessments in Phase I.
A bold new approach is required to tackle these challenges while significantly reducing both time and cost. New methods for the review of patient profiles, monthly safety trending, dose escalation review and the support of tables, listings and figures deliverables are required. A dose cohort review that can be done in near real time can shorten recruitment timelines or a study team’s medical monitor can swiftly identify an increase in infections driving protocol amendment discussions.
To tackle this data reporting challenge, one must first look to how best to present information to the varying end user reviewers to allow both high-level overviews, as well as drill down functionality to assess specific details.
Reporting and Analysis Dashboards
Addressing all these review challenges requires a completely new approach to reporting. Modern practices pre-empt questions that may be asked by implementing comprehensive and dynamic systems that contain all the clinical data collected on a study, or series of studies, updated at a frequency and timing necessary to get value out of those answers. For example, there is no point in implementing a system that supports dose escalation review that isn’t available until after the relevant meeting has been held. Reporting technology now allows data to be reviewed frequently, iteratively in a very consumable web-based format that leads to reduced study timelines.
To achieve this at PPD, data collected in a clinical study is automatically loaded in near real time into a dynamic and comprehensive review environment that feeds into the company’s Preclarus® Patient Data Dashboard. The interface for the dashboard has been designed through years of user feedback to provide the best combination of simplicity and configurability to allow the user to easily adjust the displays themselves and to quickly find the answers to any questions they might have. In addition, users define and answer questions through visualizing the appropriate subjects and subject data.
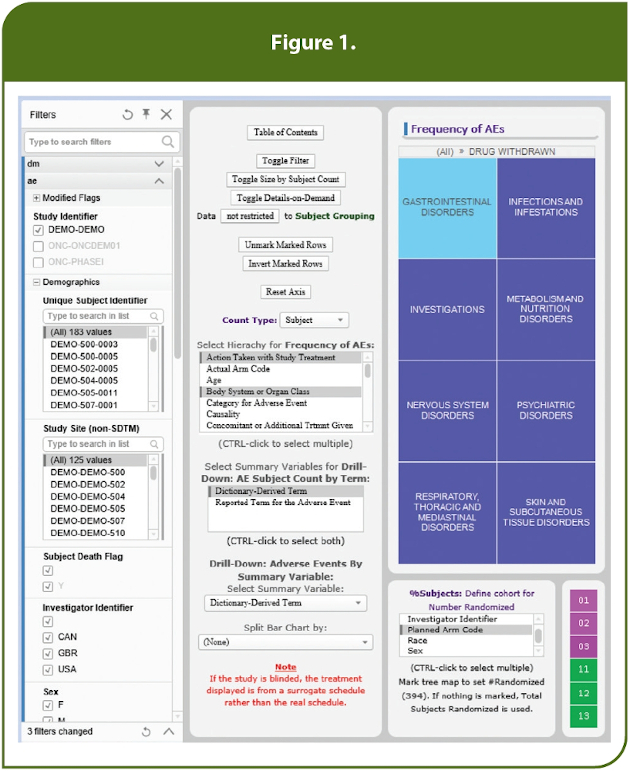
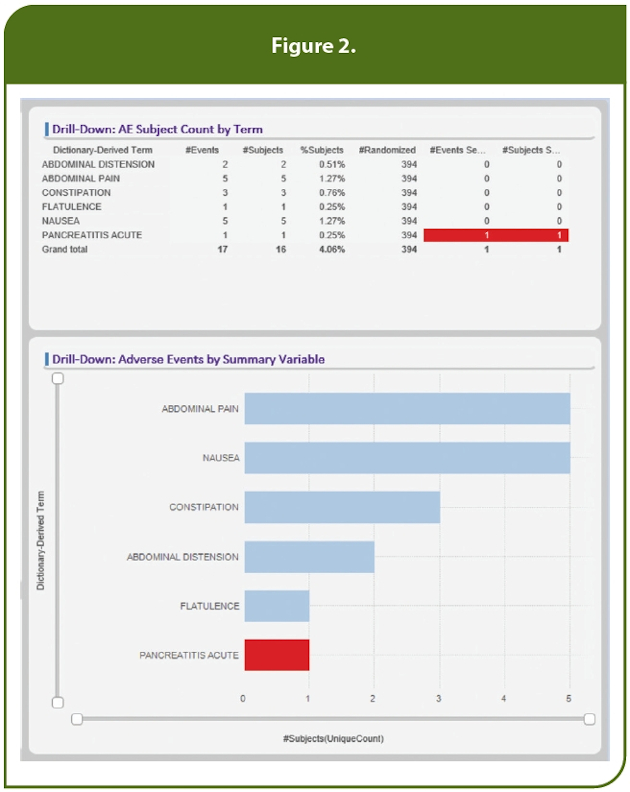
For example, in Figure 1, the user is investigating the frequency of adverse events (AEs) and by using the “Select Hierarchy for Frequency of AEs” pick list has chosen to focus on the system organ classes for subjects whose drug was withdrawn as an area of specific interest. This generates a tree map, colored by frequency, that focuses specifically on the subjects of interest. Filters also could have been set to narrow the search further, e.g., to specific investigator sites. In this example, we have filtered the randomized population to only dose cohorts 11, 12 and 13. By then selecting a specific system organ class, e.g., “Gastrointestinal Disorders,” within the tree map, only the 16 subjects with these specific AEs of interest are displayed, as noted in Figure 2.
The users will want to know as much as possible about these 16 subjects. To satisfy this expectation we automatically capture these specific subjects for further analysis. In Figure 3, the labs for these subjects are reviewed individually or they can be plotted together to look for trends. In this case, we are reviewing change from baseline for liver function tests, but any lab tests can be selected. The user may choose to review these results differently, e.g., the actual values with reference ranges or review upper limit of normal assessments to assist with Hy’s Law. Users require many ways to review lab data and across other relevant tests, e.g., ECG, vital signs and respiratory response, to name a few.
All the key data collected on the 16 subjects also can be reviewed together in a single timeline view, as shown in Figure 4. Where AEs can be plotted against important study milestones, the visit schedule, non-normal labs, study treatment, concomitant medications and medical histories etc., highlighting key safety and efficacy signals over the life of the subject’s study conduct. Specific therapeutic area data collections, e.g., disease response in oncology and reactogenicity in vaccines, also can be added to the timeline as well.
Turning Data into Actionable Information
As the saying goes, no two studies are alike. The same can be said about the collection layout of the electronic case report forms (eCRFs) and data from numerous other sources (images, eCOA, wearables, etc). In reviewing the clinical sources and data models available it was determined that the best data source for the dashboard would be the Standard Data Tabulation Model (SDTM) from CDISC® (Clinical
Data Interchange Standards Committee). The SDTM model contains recognized industry storage/collection standards for safety and efficacy while also adopting and expanding standards specific to therapeutic areas, such as oncology, rare disease, HIV, vaccines, etc.
As the study data within SDTM standards adapt and change, so do the dashboards presented to end users. In addition, data standardized in an SDTM structure allows for a different focus and review by a variety of clinical audiences, including pharmacovigilance (PV), clinical data management (CDM), clinical trial leads (CTM), project management (PM) and data analytics (DA). For example, PV personnel can review for safety signals and trends, CDM can look across timepoints for data discrepancies, CTM can review for accuracy of data monitoring, and the PM can look at planned and missing collection timepoints.
Clinical trial data volume has exploded as the traditional data collections streams are joined by real-world data, eSource and data directly generated from patients. Even using a standard data collection model in SDTM format does not eliminate the need for the end user to wade through numerous entries with each review cycle.
The re-review time alone can be extremely time consuming for the end user, while not adding study value. To remove this burden, new and updated records are flagged since the last dashboard refresh.
That allows audience data review to be targeted, timely and accurate to assess the observations that have been created or modified since the last review cycle, while retaining for the dashboard all of the observations to allow other reviewers the full study trend and safety signal review.
Leveraging SDTM data as the dashboard data source adds enhanced flexibility to study teams to customize their SDTM to bring nonstandard data elements, “supplemental variables,” into the primary dashboard views and filters for the study team. Imagine your program is collecting secondary endpoint or key ancillary information about AEs or lab results, which does not align with the SDTM data model.
With flexible SDTM design, these endpoints could be made available within the dashboard and as part of the user filters.
To achieve a singular dashboard experience to meet varying reviewers needs, the visualizations are automatically established at the project level for a single set of study-specific SDTM or are able to be combined across a collection of studies as defined by the project, such as at the compound or portfolio level. By automatically adding or removing pages and features depending on what it finds in the SDTM data itself the user experience is greatly improved as each dashboard is automatically tailored specifically to the study data that is of interest to the users within a defined project, including CDISC’s therapeutic user guide standards.
This approach is fully scalable, available and timely as there is no customized programming study by study required. In addition, knowing that therapeutic and compound specific dynamics exist, there needs to be demonstrated flexibility to achieve these means.
Special customization tools allow quick and easy modification at the project level to maintain scalability, including “alerts.” Ease of implementation and scalability must be a major driver when creating an enterprise-level dashboard.
Any tool is only as good as the end-user value that can be extracted from it. By using industry leading dashboard technology and data collection standards, data is converted into actionable information visible through standardized data presentations, which provide end users maximum control and flexibility to perform their varying data review duties.
Faster Insights and Near Real-Time Decision-Making
Combining clinical trial data, whether it’s from a single study or a collection of studies, at the compound or portfolio level, into the industrywide standard, SDTM, along with a dynamic and comprehensive review dashboard environment, significantly increases data transparency. That means trial data in near real time can be reviewed more efficiently with greater accuracy than traditional listings. Enabling faster insights to improve clinical trial efficiency and quality, which help reduce the time-cost curve for delivering life-changing therapies.
End users can see benefits in timelines and cost efficiencies by interacting with and evaluating the data more immediately, without having to rely on others to provide the information, so that safety, study design and conduct evaluations and decisions can be made in real time. Visualizations present advantages to review only those data points of interest for the reviewer and allow drill down where items require scrutiny. With the use of “flagging,” end users can target their review to only new and updated records. Time and effort are significantly reduced as efforts for review cycles in consolidating listings and/or data sources are eliminated to allow end users to focus on decision-making. Dashboard data also can be exported for use in applications such as Microsoft Excel or PDF reports to allow information dissemination to team members without access to a data review tool.

The use of the dashboards empowers end users with actionable data intelligence for faster insight and decision-making. These benefits include proactive identification of risks within clinical trials (riskbased monitoring), early review/assessment of the study data to consider adapting monitoring decisions and early trend results to consider whether protocol amendments or design considerations are warranted. For example, medical monitors can utilize a summary dashboard to evaluate safety profiles across a project and identify data trends, i.e., safety signals. That enables them to immediately drill down to subject-level results data for subjects who are presenting the safety signal and require further investigation.
Another major advantage of applying SDTM industry standards as the dashboard source is that reviewers have the benefit of reviewing data beyond a single study. The SDTM can be integrated within a program, compound or entire sponsor data warehouse that provides a single visual dashboard review and drill down of the entire series of clinical studies. This integrated data leverages benefits by allowing safety, coding and data review across studies and compounds to ensure consistency and ongoing accuracy to safety and efficacy review.
For example, users can visualize a current summary of AEs and the number of occurrences throughout an entire compound, including SAEs displayed by body system and organ class with row-by-row drill down capabilities. Also available are efficacy visualizations for specific therapeutic areas such as oncology (disease response, tumor identification and tumor results) and cardiology (clinical events, death details and questionnaires) in addition to safety data review.
Conclusion
By using industry standard visualization and web-based analytics technologies and by applying U.S. Food and Drug Administration approved SDTM, cost-effective ongoing review of trial data during trial conduct is now a reality. It is now possible to deliver actionable intelligence for faster insights and near real-time decision-making to improve patient safety monitoring, provide specialist therapeutic area scrutiny and transform governance and oversight of the trial, while simultaneously enabling an earlier understanding of clinical trial performance to improve both clinical trial efficiency and quality.
Where globally dispersed clinical study teams – including medical reviewers, clinical reviewers, biostatisticians, project managers, clinical trial managers, data analytics and data management – all have complete data visibility, they can interact with and evaluate data immediately without having to rely on others to provide that information. Through automatically generated web-based visualizations, clinical teams can evaluate safety profiles, supervise trial progress, assess study data to adapt monitoring decisions, review data for entry errors, and investigate subject and study trends. Clinical study teams can drive timely decisions at both the study and portfolio level by being afforded complete visibility not just for a single study, but across a series of studies, a compound or even at the therapeutic level.
This new approach has prepared us for the future of ongoing data review and actionable intelligence. With data diversity expanding as the industry looks to incorporate more decentralized data repositories – for example, delivery of continuous patient data through wearables, often unstructured – the need for real-time visibility will only further accelerate. This acceleration will be enhanced by processing advances from improvements in data capture technologies and an increased use of artificial intelligence, as well as the continued adoption of global research industry data standards. Reporting flexibility will need to increase to accommodate the growing number of adaptable studies, the development of flexible trial designs deployed to reduce trial cycle times, synthetic control arms, simulated trials, patient-centered trials and precision medicine. These all are expected to have a long-term positive effect on research. Our introduction of near real-time, dynamic, web-based and visual reports has brought our people closer to the data relevant to them and has greatly expanded the user base. This includes external research partners so that all data-driven decisions are made through a single lens. This ensures that the right people, get the right data, to make the right decisions at the right time.
Reference
CDISC Standard Data Tabulation Model (SDTM): https://www.cdisc.org/standards/foundational/sdtm