Katherine Lovejoy,1 Susanne Fabel,1 Carolin Kraus,1 Derek Wood,2 Xiaochun Yu,2 Aaron Lamb,3 - 1 Thermo Fisher Scientific, Germering, Germany; 2 GMP lab, PPD clinical research business, Thermo Fisher Scientific, Middleton, Wisconsin, USA; 3 Thermo Fisher Scientific, Hemel Hempstead, GB
Keywords
Vanquish Duo UHPLC system, Charged Aerosol Detector, CAD, compound identification, single quadrupole mass spectrometry, epoxidized soybean oil, process impurities.
Introduction
Extractable and leachable (E&L) assessments and testing are part of a key regulatory requirement for many types of pharmaceutical products and food packaging systems to ensure product integrity and patient safety.
E&L compounds can be categorized based on their relative volatility. Non-volatile organic E&L compounds are traditionally monitored with UHPLC-UV-MS (LC/UV-MS) instrumentation, while semi-volatile and volatile compounds are tracked using direct injection and headspace GC/MS, respectively. A limitation of LC/UV-MS as a screening tool for unknown compounds is that neither UV nor MS are universal detectors. UV detection requires a suitable chromophore, while mass spectral detection requires a chemical structure that provides sufficient ionization. Another challenge for LC/UV-MS is accurately quantitating unknown/unspecified impurities, as there is no authentic standard available. Although surrogate standards may be used for quantitation, response factors can vary widely with LC/MS and LC/UV detection, and use of a surrogate standard to quantitate unknowns may therefore not provide accurate quantitation. To address the variableness in response factors, standard practice is to apply an uncertainty factor that effectively lowers the reporting threshold for unknown compound chromatogram peaks to help prevent underreporting unknown extractables or leachables. Lower uncertainty factors add more time and cost in evaluating more chromatographic peaks for compounds that may not actually pose a risk.
This article presents the use of charged aerosol detection (CAD) combined with LC/UV-MS to obtain a more complete E&L profile that is not reliant on a UV chromophore, and which also provides accurate quantitation for unknowns by achieving more consistent relative response factors for non-volatile unknowns. CAD is unsuitable for quantitating volatile compounds and, except in the case of a complex formation,1 is best suited for accurate quantitation of non-volatile and, within certain limits, semi-volatile compounds. Depending on mobile phase additives and evaporation temperature detector settings, volatile and certain semi-volatile compounds will be lost during the evaporation step, which will reduce the peak response factor and sensitivity for these compounds. A non-volatility factor assessment was applied to measure and categorize unknown compound relative volatility, since volatile and semi-volatile peaks can be designated for more appropriate quantitation with GC/MS analysis instead of LC/ CAD. Evaluation by GC/MS should always be included as part of a complete E&L assessment.
To demonstrate the use of LC/UV-MS-CAD as a solution for more complete and accurate E&L compound profiling, a well-characterized in-house method for E&L compound quantification and for MS library data generation was used in combination with CAD to achieve a more complete, single-pass detection and quantification of extractables from medical- and pharmaceutical grade-plastics. Three orthogonal detectors facilitated analysis of analytes with diverse chemical natures. Analytes were classified as non-volatile or semi-volatile in the CAD using an established method.2 Because CAD is the best quantification tool for non-volatiles (substances that are non-volatile under CAD analysis conditions), this method gives the user definitive information about which peaks should be quantified by LC and which by GC. The approach minimizes inter-analyte response factor variation and increases quantitative accuracy, thereby minimizing the uncertainty factor as noted previously. An inverse gradient strategy was implemented and further refined with an in-line mixer and optimized gradient delay times. The other two detectors were a single quadrupole MS (Thermo Scientific™ ISQ EM Single Quadrupole Mass Spectrometer) and a diode array UV detector. The goal was to find the most efficient and cost-effective strategy to meet key requirements in E&L studies of potentially harmful substances.
Choosing an Appropriate System Configuration
A dual pump module housing two independent gradient pumps was used. One provided the analytical gradient, while the other provided an inverse (makeup) gradient. The mobile phases were freshly prepared daily (aqueous) or every two days (organic) to prevent baseline drift in the CAD. Factors affecting CAD performance have been reviewed in great detail.3 The system components are shown in Figure 1.
The standard method and extensive experimental details are available at https://appslab.thermofi sher.com/. The analytical gradient (Table 1) was run with a 10 µL injection at 0.45 mL/min from 80% A (2.5 mM ammonium acetate in water) and 20% B (2.5 mM ammonium acetate in methanol) to 100% B over 20 minutes. A Thermo Scientific™ Hypersil GOLD™ C18 3.0 x 100 mm, 1.9 µm column was used at 60 °C. The Thermo Scientific™ Chromeleon™ 7.3.1 Chromatography Data System (CDS) including the inverse gradient instrument method wizard was used for data acquisition and analysis.
Injection sequence
The injection sequence in Table 2 was used to confirm system suitability, perform periodic checks on the system performance and manage carryover. Large volume blank injections reduced carryover. Although the needle is in the pressurized flow path during the run, holding a large volume at system pressure prior to injection facilitates sample desorption from the inner needle walls.
MS Settings
Instrument settings for the ISQ EC MS are shown in Table 3. SIM scan mass lists for unknowns were taken from prior analyses of PVC4,5 and are available online (https://appslab.thermofi sher.com). The SIM scan method would have accommodated one full scan. Instead, an additional full-scan injection was made, which had one negative mode scan plus two positive mode scans, implemented to promote collection of more ions in the higher-mass range.
CAD Setup
Because CAD response is greater with higher organic content, a second pump with an inverse gradient was used to ensure effectively isocratic conditions for the CAD and MS. The left pump had a shorter path to the detector, which was corrected by a gradient delay of 610 µL.6,7 The %RSD in relative response was 15% with the inverse gradient and 41% without the inverse gradient (Figure 2). The capillary mixer, shown in Figure 1 as the very short capillary between the two T-pieces, was used to improve the uniformity of response considering backpressure changes over the gradient.8
Determination of CAD Non-Volatility Factors Q50/35 for E&L Compounds
CAD can detect and accurately quantify non-volatile and many semi-volatile extractables and leachables, when at least one surrogate standard is on hand. It has a unique capability in the quantitation of unknown non-volatile compounds as the response is independent of the analyte’s chemical structure. Since volatile and certain semi-volatile compounds may have relatively lower CAD response factors compared to non-volatile compounds, a measurement of non-volatility factors2 (Q50/35) can determine if an extractable or leachable peak is best suitable for LC/CAD or GC/MS detection and quantitation.
CAD non-volatility was determined and calculated by the following procedures:
- The sample was analyzed once with a CAD evaporation temperature (EvapT) of 35 °C and once with an EvapT of 50 °C.
- For each peak, the area at EvapT = 50 °C was divided by the area at EvapT = 35 °C to calculate the non-volatility factor Q50/35. All peaks with Q50/35 > 0.85,2 have essentially the same calibration curve and unknowns can be quantitated with a surrogate standard. Half of the peaks (standards and unknowns) in this work met this threshold.
The non-volatility factors of some common E&L compounds are listed in Table 4.
Additional studies may be required to further evaluate non-volatility factors vs. GC/MS response factors, to help determine if there is and what is the best cut-off criteria. With this information, it may be possible to determine if an E&L peak is more suitable for GC/MS quantitation and therefore excluded from LC/CAD quantitation and identification. The results in Table 4 support this approach and show that all compounds with non-volatility factors less than 0.85, such as Bisphenol A, bis(4-chlorophenyl) sulfone and diphenylphthalate, are well suited for GC/MS quantitation.
As shown in Figure 4, there was no baseline drift over the run time in the CAD standard gradient (see reference 3 for best practices). The earlier peaks are larger with the inverse gradient because these analytes pass through the detector in a more methanol-rich eluent. Higher methanol content means lower surface tension and lower viscosity (>40% MeOH). These analyte-independent effects lead to improved nebulization efficiency resulting in higher mass transport to the CAD producing a higher signal.1 The opposite is true for later peaks.
Limit of Detection, Analytical Evaluation Thresholds, Uncertainty Factors and Calibration Range
Human toxicity of a substance depends not only on the compound identity/structure and concentration but also on the patient dosing regimen. An E&L analysis should accurately quantify concentrations of potentially hazardous substances. If accurate quantification is not possible, an uncertainty factor is usually applied, so the estimated concentration will more likely err on the side of overestimation.
For accurate quantification of known standards, a calibration concentration range of 2 to 50 µg/mL was chosen based on the signal-to-noise ratios of actual standards injected at the given concentrations. E&L scientific literature also indicates use of standards at these concentrations.2,10,11,12
Relative response factors, such as those listed in Table 4 for UV, MS and CAD, assist in estimation. If a substance has a relative response factor of less than one, the concentration will be underestimated, and toxic levels may go unreported. The use of internal standard Irganox 245 yielded response factors in the CAD of greater or equal to one for all CAD non-volatiles. For the MS, normalization to Irganox 245 yielded response factors from 0.004 to 11.2. For the UV at 230 nm, normalization yielded response factors from 0.003 to 10.8.
Quantification and Relative Response Factor
The expedient choice of Irganox 245 – the substance with the lowest relative response factor for CAD of all the non-volatiles – as a universal calibrant led to a slight overestimation of the concentrations. The working solution, in which every standard was present at 10 µg/mL, yielded results from 10.32 (Irganox 245) to 14.82 µg/mL (1-octanesulfonate).
The uncertainty for the estimated amount of the non-volatile unknowns is given by the uncertainty factor, calculated by the expression:
UF = 1/(1-RSD) = 1/(1-0.15) = 1.18
Where RSD is the peak area %RSD for non-volatile.11 This uncertainty factor equation is not useable for the MS and the UV in this case, because both detectors had response factors over three orders of magnitude and inter-analyte RSDs greater than 1.
Analysis of Unknowns
The CAD is highly suited for the analysis of complex, chromophore deficient, potentially toxic oligomers that can be extracted from plastic materials.2 This analysis does not rely on ionization efficiency or the presence of a chromophore.
For example, an extracted wound dressing containing polyurethane (PU, 50/50 isopropanol/H2O, 72 h) was analyzed using the presented instrument conditions (Figure 5). Using CAD and MS, six unknown peaks were observed, and three unknowns were CAD non- volatiles (Table 5). When compared with a mass list of potentially hazardous PU extractables,5 one peak was tentatively identified as 9-octadecenamide (oleamide). The three unknowns with Q50/35 < 0.85 are detectable and identifiable by GC/MS analysis and therefore do not need further quantitation and identification with LC/CAD/MS.
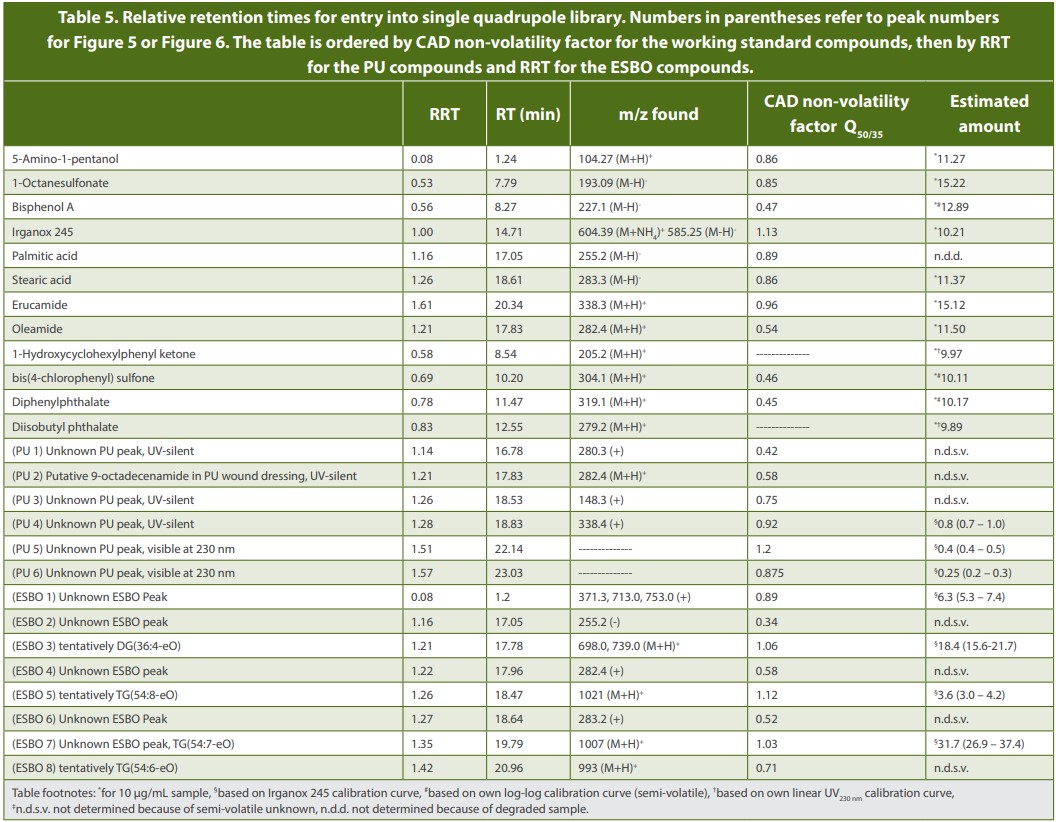
Extractions of sterile medical PVC tubing were generated using the same extraction conditions and compared to a chromatogram of epoxidized soybean oil (ESBO) (Figure 6). ESBO is used as a plasticizer and stabilizer in polyvinyl chloride plastics. Eight peaks were observed. Four were CAD non-volatiles and were quantified by CAD (Table 5). Four were CAD semi-volatiles with non-volatility factors below 0.85, and therefore were better suited for detection and identified with GC/ MS, and therefore do not need further quantitation and identification using LC/CAD/MS.
Conclusion
- LC/CAD/MS analysis, along with an established method for E&L quantification and a single-quadrupole MS library, can assist in time savings and cost, resulting in improved detector signal and quantification accuracy for unknowns.
- The uncertainty factor was minimized and quantification was optimized through three improvements: 1) Classifying unknowns as non-volatile or semi-volatile based upon the CAD non-volatility factor; 2) Using an inverse gradient to ensure isocratic conditions; and 3) Mixing with an inline capillary mixer after the merge point of the analytical and inverse gradients and before the flow split for uniformity of response.
- Measuring and assigning non-volatility factors facilitates the determination of whether an E&L peak is a volatile/semi[1]volatile compound and will be detected and identified by GC/ MS, therefore minimizing duplicate work of identifying the same compound from both GC/MS and LC/MS.
- Use of a single quadrupole MS allowed identification of known extractables against an in-house compound database and putative annotation of unknowns.
- The baseline drift in CAD and MS was avoided by repreparing mobile phases every day or every second day.
References
- Gamache PH, ed. (2017), Charged aerosol detection for liquid chromatography and related separation techniques, John Wiley & Sons, Inc., Hoboken, NJ, USA. https://doi.org/10.1002/9781119390725.
- Eckardt M, Kubicova M, Simat TJ. (2018) Universal response quantification approach using a Corona Charged Aerosol Detector (CAD) - Application on linear and cyclic oligomers extractable from polycondensate plastics polyesters, polyamides and polyarylsulfones. J Chromatogr A. Oct 19;1572:187-202. doi: 10.1016/j.chroma.2018.08.051. Epub 2018 Aug 23. PMID: 30153980.
- Thermo Fisher Technical Guide 73914 (2021). Getting the most out of your charged aerosol detector: Factors influencing charged aerosol detector performance.
- Thermo Fisher Application Note 001586 (2022). Generation of a custom spectral library for the identification of plant oil-based additives in extractables and leachables analyses. https://assets.thermofisher.com/TFS-Assets/CMD/Application-Notes/an-001586-pb[1]extractables-leachables-plant-oil-additives-an001586-na-en.pdf.
- Groh KJ, Backhaus T, Carney-Almroth B, Geueke B, Inostroza PA, Lennquist A, Leslie HA, Maffini M, Slunge D, Trasande L, Warhurst AM, Muncke J. (2019) Overview of known plastic packaging-associated chemicals and their hazards. Sci Total Environ. Feb 15;651(Pt 2):3253- 3268. doi: 10.1016/j.scitotenv.2018.10.015. Epub 2018 Oct 4. PMID: 30463173.
- Thermo Fisher Scientific Technical Note 73449 (2019). Why use charged aerosol detection with inverse gradient? https://assets.thermofisher.com/TFS-Assets/CMD/Technical-Notes/ tn-73449-cad-inverse-gradient-tn73449-en.pdf.
- Thermo Fisher Scientific Technical Note 72806 (2019). Charged Aerosol Detection: Factors Affecting Uniform Analyte Response. https://assets.thermofisher.com/TFS-Assets/CMD/ Technical-Notes/tn-72806-uhplc-charged-aerosol-detection-tn72806-en.pdf.
- De Pra M, Ispan DA. (2023) Working title: Implementation of the inverse gradient with split flow. Manuscript in preparation.
- Thermo Fisher Scientific Technical Note 73299 (2019). Charged Aerosol Detection – use of the power function and robust calibration practices to achieve the best quantitative results. https://assets.thermofisher.com/TFS-Assets/CMD/Technical-Notes/tn-73299-lc-cad[1]calibration-tn73299-en.pdf.
- Jordi MA, Rowland K, Liu W, Cao X, Zong J, Ren Y, Liang Z, Zhou X, Louis M, Lerner K. (2020) Reducing relative response factor variation using a multidetector approach for extractables and leachables (E&L) analysis to mitigate the need for uncertainty factors. J Pharm Biomed Anal., Jul 15;186:113334. doi: 10.1016/j.jpba.2020.113334. Epub 2020 May 1. PMID: 32387747.
- Jordi M, Heise, T. (2021) An Analytical Strategy Based on Multiple Complementary and Orthogonal Chromatographic and Detection Methods (Multidetector Approach) to Effectively Manage the Analytical Evaluation Threshold (AET). PDA Journal of Pharmaceutical Science and Technology, May 2021, 75 (3) 289-301; https://doi.org/10.5731/pdajpst.2020.012047.
- Sica VP, Krivos KL, Kiehl DE, Pulliam CJ, Henry ID, Baker TR. (2020), The role of mass spectrometry and related techniques in the analysis of extractable and leachable chemicals. Mass Spec Rev, 39: 212-226. https://doi.org/10.1002/mas.21591.
Derek Wood serves as a senior principal scientist within the PPD clinical research business of Thermo Fisher Scientific. He holds a Bachelor of Science in biochemistry and has more than 30 years of pharmaceutical CRO experience, including 20+ years with the PPD business, where he has held various positions of scientific and business leadership.
Xiaochun Yu, Ph.D., serves as a senior principal scientist within the PPD clinical research business of Thermo Fisher Scientific and as a subject matter expert in the extractables and leachables (E&L) study area. He has been leading E&L studies for 20 years, overseeing the design and successful execution of E&L programs for numerous drug products.
Katherine Lovejoy, Ph.D., serves as an application chemist at the Thermo Fisher Scientific HPLC factory site and has a Ph.D. in inorganic chemistry from the Massachusetts Institute of Technology. She has experience as a chemist reviewer at the FDA and as a scientist at Los Alamos National Laboratory.
Susanne Fabel serves as a product marketing manager in chromatography and mass spectrometry at Thermo Fisher Scientific. Her passion is to help develop world-class HPLC instruments to take science one step further. She has more than 15 years of experience in chromatography and holds a Ph.D. in analytical chemistry from the Technical University of Munich.
Aaron Lamb serves as a pharma and biopharma vertical marketing manager working in the chromatography and mass spectrometry division at Thermo Fisher Scientific, UK. He collaborates with pharmaceutical manufacturers, analytical testing labs and is responsible for generating collateral and the planning of pharma and biopharma campaigns. Aaron also has worked in the industry as an R&D and pharma team leader at Intertek using a multitude of analytical techniques, including ion chromatography, GC–MS and LC–MS in health care and pharmaceutical analyses.
Carolin Kraus, B.Sc., serves as a working student within the product applications team at Thermo Fisher Scientific, Germering. She holds a bachelor's degree in biotechnology and food science from the University of Hohenheim and is currently pursuing a Master's degree in molecular biotechnology at the Technical University of Munich. She has experience in bacterial cell culture and bacterial protein expression.
Subscribe to our e-Newsletters
Stay up to date with the latest news, articles, and events. Plus, get special
offers from Pharmaceutical Outsourcing – all delivered right to your inbox! Sign up now!